Projectile Motion
Title: Projectile Motion Lab
Partner: Abbey Applegate
Date: 10/22/14
Partner: Abbey Applegate
Date: 10/22/14
Purpose
The purpose of this lab was to predict the range of a projectile and find the accuracy of our prediction.
Theory
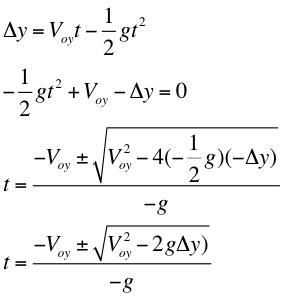
In order to calculate the range of the projectile, we needed to derive an equation. We knew only the values for the variables of initial velocity, delta y, and the angle theta. We can use the third kinematic equation and the quadratic formula to solve for time as shown below.
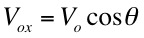
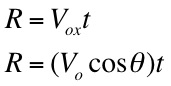
Next, we can use the original range equation and the relationship between initial velocity and theta to derive an equation that will help us find range using the variables we know.
|
|
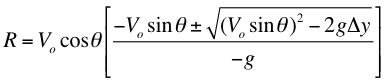
Finally, we can substitute our equation for time into the modified range equation to get the following:
Experimental Technique
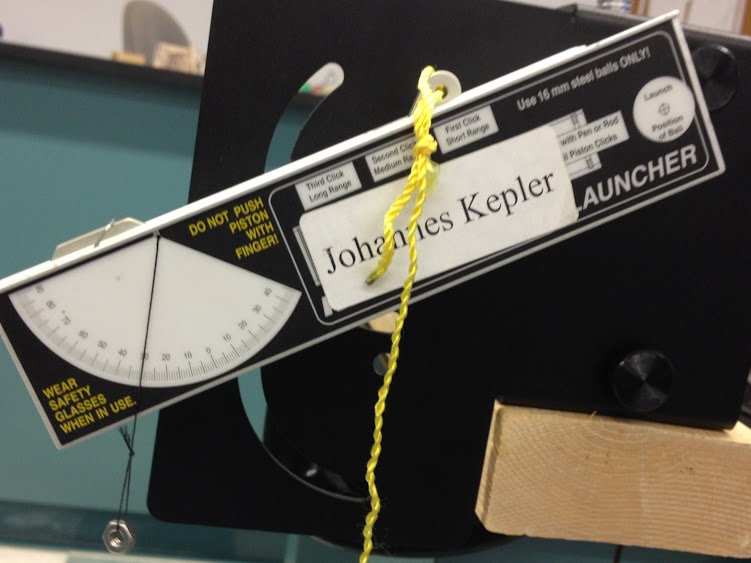
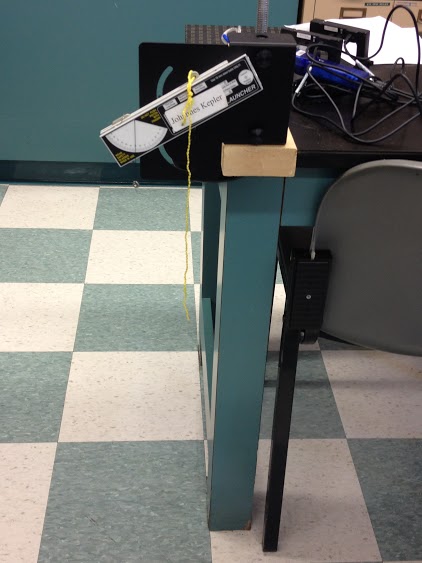
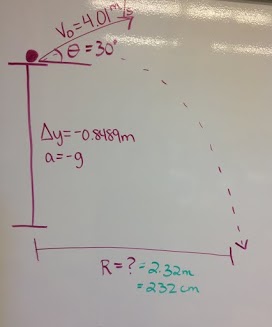
The launcher was set up as shown on right and set to a specific angle. The initial velocity was measured using Photo Gates. The velocities of ten launches were averaged to find the velocity used for calculations. The launch height of the ball was also measured to be used as delta y. Initial launch position was marked using a plumb bob.
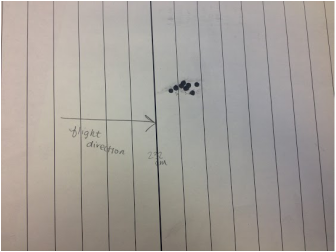
The range of the projectile was then predicted and ten shots were fired onto carbon paper. The ranges of each of these shots were measured using a ruler, and the difference between the predicted range and the average range was analyzed. |
|
Data
The angle of the launcher was set to 30 degrees.
The launcher was set to the second setting.
The distance from the bottom of the ball to the floor (delta y) was measured to be 84.89 cm, or 0.8489 m.
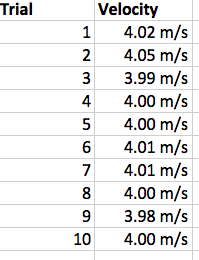
The velocities measured for each of the ten trials were recorded in the data table at bottom left.
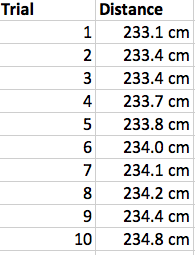
After predicting the range, the results of the ten shots fired are shown in the data table below on the right. The marks left by the ball through the carbon paper are shown in the bottom middle image.
The launcher was set to the second setting.
The distance from the bottom of the ball to the floor (delta y) was measured to be 84.89 cm, or 0.8489 m.
The velocities measured for each of the ten trials were recorded in the data table at bottom left.
After predicting the range, the results of the ten shots fired are shown in the data table below on the right. The marks left by the ball through the carbon paper are shown in the bottom middle image.
|
|
|
Analysis
The average of the ten initial velocity measurements was taken to find the value used in the calculation. It was found to be 4.01 m/s.
|
Using the derived equation for range, the following calculation was performed:

|
The average measurement for the range came out to be 233.89 cm.
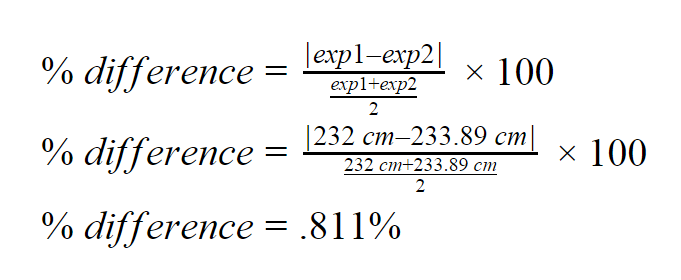
From this, we were able to calculate percent difference as shown below. This compares the actual value to the calculated value with less than 1% difference.
From this, we were able to calculate percent difference as shown below. This compares the actual value to the calculated value with less than 1% difference.
Conclusion
The purpose of this lab was to predict the range of a projectile object, and we were able to do so with only a 0.811% difference between the calculated range and the experimental range of the projectile. The measured range was larger than the calculated range.
Because the average range was about 2 cm away from the predicted measurement, the uncertainly for the range calculation can be said to be roughly ± 2 cm.
Sources of error for the measurements are as follows:
Change in Y- Parallax error, meaning "a change in position of an object resulting in a change in position of the observer," may have contributed to a position measurement slightly above or below the true position of the bottom of the ball within the launcher.
Initial Velocity- Slight misalignments in the Photo Gates could cause small variations in the velocity measurement.
Angle- Parallax error could also occur in the angle measurement.
I do not think that wind resistance could be a factor because the steel ball is heavy enough that it would not be affected notably. Additionally, the location of the launch was not directly in the line of the air conditioning unit, which would have contributed to the bulk of the wind resistance. Furthermore, the experimental range was shown to be larger than the calculated range, and if wind resistance would have contributed, it would be logical to assume that the ball would have landed shorter than expected.
References
Giancoli, D. (1998). Physics: Principles with Applications (5th ed.). Upper Saddle River, N.J.: Prentice Hall.
Lahs Physics (n.d.). Retrieved October 6, 2014, from www.lahsphysics.weebly.com
Parallax error. (n.d.). Retrieved October 27, 2014, from http://www.thefreedictionary.com/Parallax+error.
Lahs Physics (n.d.). Retrieved October 6, 2014, from www.lahsphysics.weebly.com
Parallax error. (n.d.). Retrieved October 27, 2014, from http://www.thefreedictionary.com/Parallax+error.
