Energy Lab
Title: Energy Lab
Date: 1/7/15
Partner: Abbey Applegate
Date: 1/7/15
Partner: Abbey Applegate
Purpose
The purpose of the lab is to investigate energy transfers and properties associated with springs, particularly the spring constant and velocity.
Theory
|
PART ONE: CALCULATING THE SPRING CONSTANT
In 1660, physicist Robert Hooke discovered a law of elasticity that states that for small deformations of an object, the displacement is directly proportional to the force causing the deformation, and when this load is removed, the object's original shape is restored. This law is traditionally and most easily applied to situations involving springs.
In order to calculate the spring constant, Hooke's Law (shown below) needs to be utilized.
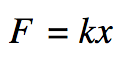
In this equation, the force F is equal to the spring constant k times the compression x. This is a linear equation where k will be the slope of a line on a Force vs. Compression graph with units N/m.
|
PART TWO: PREDICTING THE VELOCITY
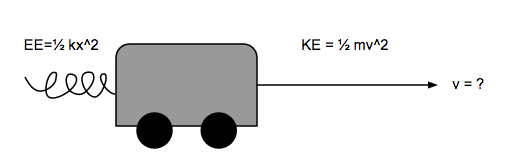
In order to calculate the theoretical velocity of the cart after the spring is released, an equation needs to be derived. In the diagram above, the compressed spring gives the cart elastic potential energy (EE). Once the spring is released, the moving cart has kinetic energy (KE).
The law of conservation of energy states that energy cannot be created or destroyed, only transferred from one form to another. Thus, the elastic potential energy before the release must be equal to the kinetic energy after the release. The following equation can be derived: 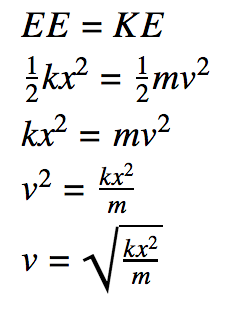
|
Experimental Technique
The spring used for this experiment was black.
|
PART ONE:
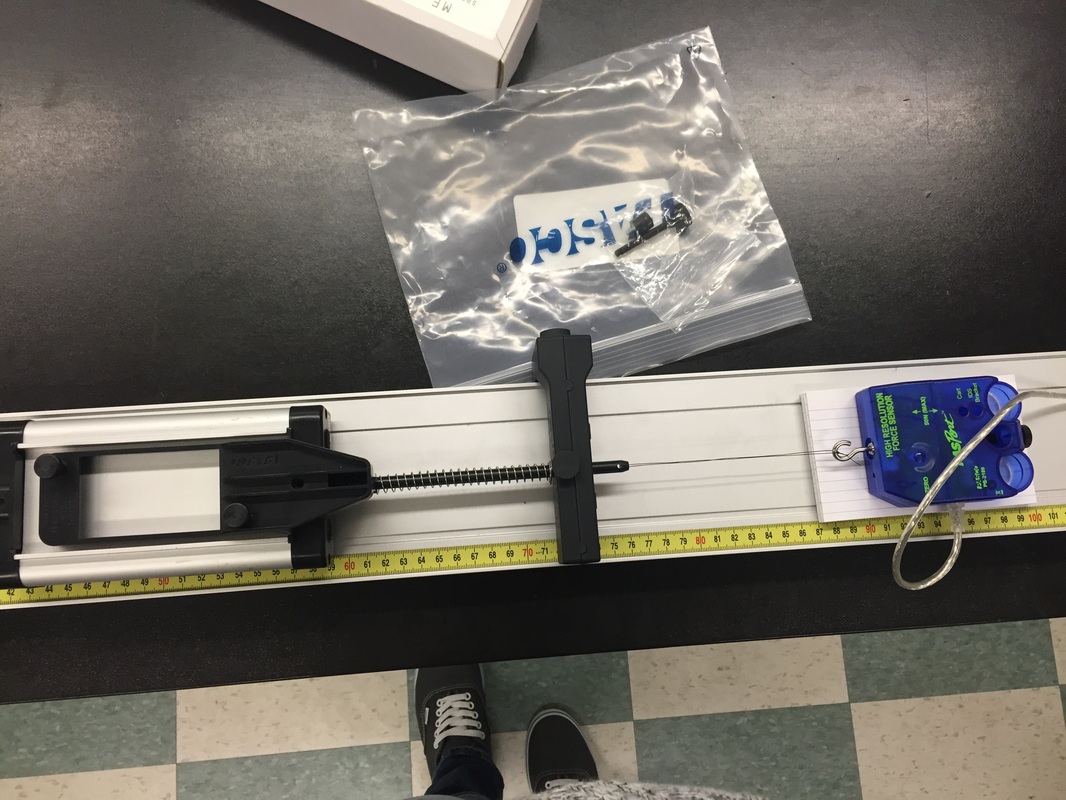
The apparatus was set up as shown below. A force sensor was attached to the string and used to measure the force acting on the spring. Index cards were stacked under the force sensor to level the string and make sure that the force being applied was parallel. Be sure to zero the force sensor before beginning. In addition, compression was measured with each force measurement in constant intervals. Ten data sets were collected using Data Studio.
|
PART TWO:
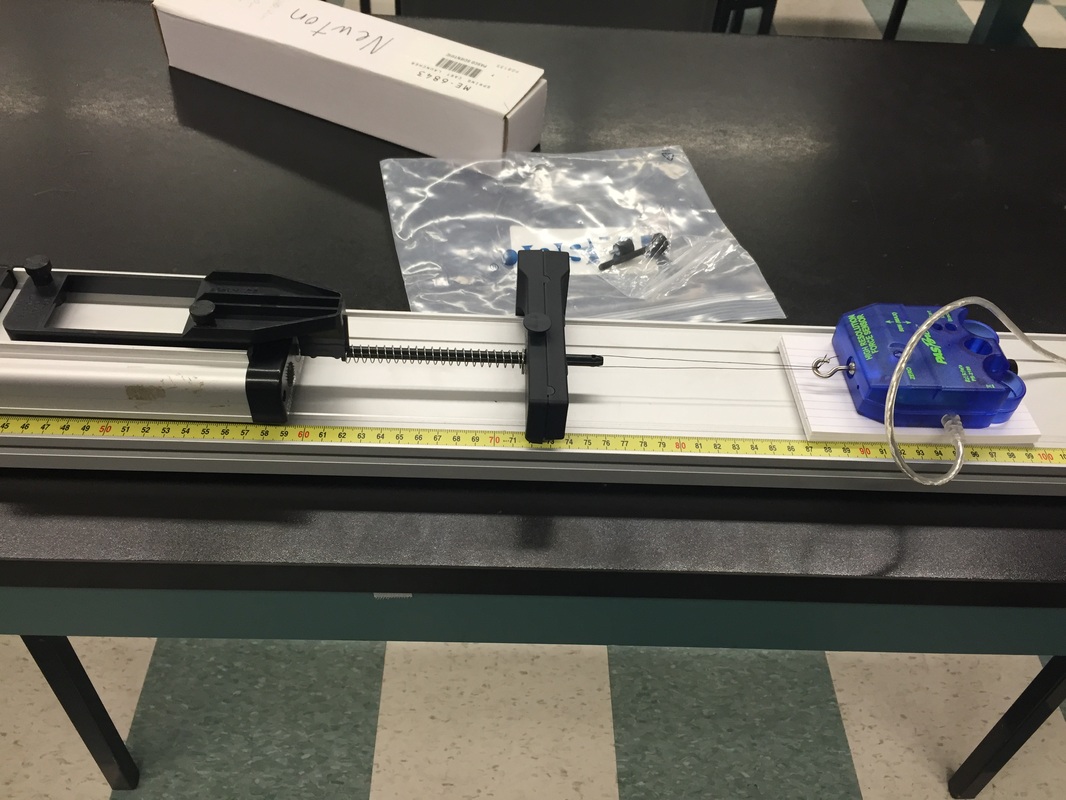
The above apparatus was used to measure velocity through a photogate after the cart was released. The top bar of the picket fence was used as the flag length. Measurements were made at full relaxation and compression in order to calculate the x value. Ten data runs of velocity were collected and an average was taken.
|

Data
|
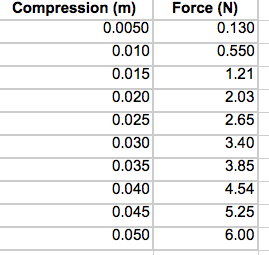
PART ONE:
The following measurements were made using Data Studio and the black spring.
|
PART TWO:
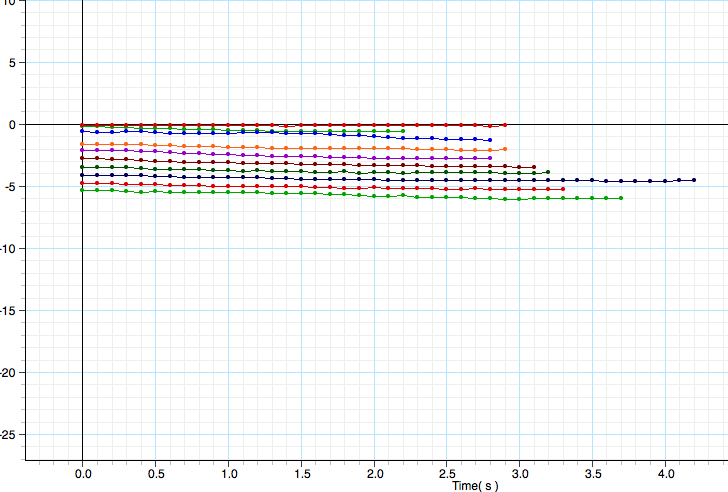
The flag length was 0.0250 m.
The mass of the cart was 0.558 kg. The compression (x value) was 0.052 m. The following velocities were measured using the photogate and Data Studio. The average velocity was determined to be 0.84 m/s. 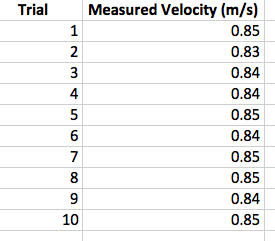
|
Analysis
|
PART ONE:
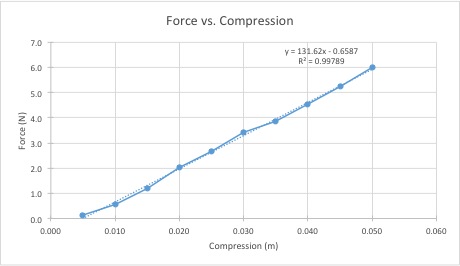
A Force vs. Compression graph of the data (below) was made with a linear trendline. Because the trendline is in the form y=mx + b just like F=kx, the k value can be pulled off the graph as 1.3 x 10^2 N/m. The correlation coefficient of .998 proves that this linear relationship is strong and the spring constant is very accurate.
|
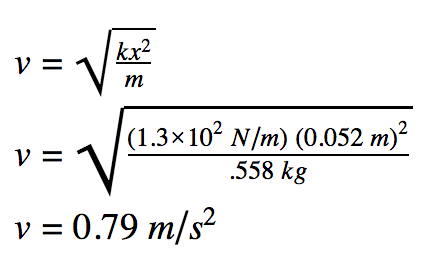
PART TWO:
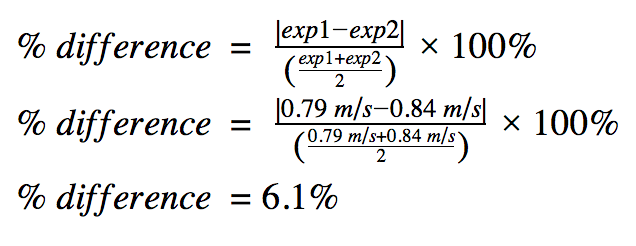
Using the derived equation and the data above, the velocity was calculated to be 0.79 m/s.
Percent difference between the measured and calculated values was then determined as shown below.
|
Conclusion
The purpose of Part One of this lab was to determine the spring constant of the black spring by measuring force and compression and utilizing graphical analysis. It was determined that the spring constant was 1.3 x 10^2 N/m. With a correlation coefficient of .998 indicating a strong linear correlation, it can be concluded that this is an accurate value.
The purpose of Part Two of this lab was to determine the velocity of the cart after the compressed spring was released to its original position. Energy transfers from elastic potential energy to kinetic energy were investigated to determine that the velocity was 0.79 m/s^2 with 6.1% error. Possible sources of error are photogate misreadings using the picket fence or inconsistent launch speeds of the spring giving an inaccurate average measured velocity.
The purpose of Part Two of this lab was to determine the velocity of the cart after the compressed spring was released to its original position. Energy transfers from elastic potential energy to kinetic energy were investigated to determine that the velocity was 0.79 m/s^2 with 6.1% error. Possible sources of error are photogate misreadings using the picket fence or inconsistent launch speeds of the spring giving an inaccurate average measured velocity.
References
Giancoli, D. (1998). Physics: Principles with Applications (5th ed.). Upper Saddle River, N.J.: Prentice Hall.
Hooke's Law. (n.d.). Retrieved January 14, 2015, from http://www.britannica.com/EBchecked/topic/271336/Hookes-law
Lahs Physics (n.d.). Retrieved October 6, 2014, from www.lahsphysics.weebly.com
Scientists. (n.d.). Retrieved January 14, 2015, from http://www.vigyanprasar.gov.in/scientists/Hooke.jpg
Hooke's Law. (n.d.). Retrieved January 14, 2015, from http://www.britannica.com/EBchecked/topic/271336/Hookes-law
Lahs Physics (n.d.). Retrieved October 6, 2014, from www.lahsphysics.weebly.com
Scientists. (n.d.). Retrieved January 14, 2015, from http://www.vigyanprasar.gov.in/scientists/Hooke.jpg
